Scientific observations are rarely perfect. Measurements may contain missing values, timing errors, calibration offsets, sensor drift, interference, duplicated records or incorrect metadata. These problems can lead to misleading scientific conclusions if they are not identified before the data are analysed.
This project will investigate whether a common automated system can determine what has gone wrong with scientific observational data. Rather than simply labelling an observation as unusual, the aim is to diagnose the likely type and severity of the data-quality problem.
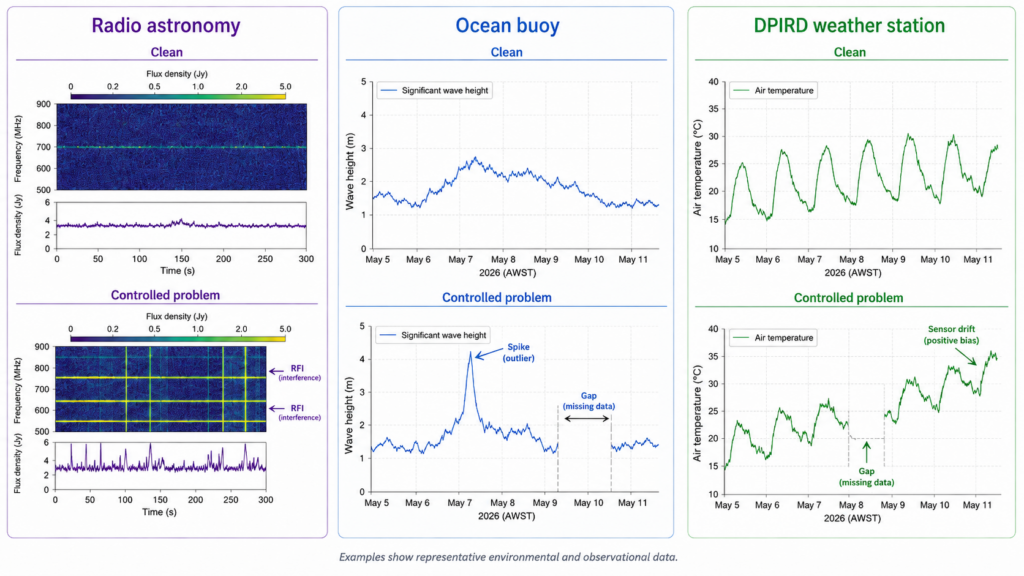
The student will work with examples from three different observational domains: radio astronomy observations, ocean buoy measurements and weather-station data from the Western Australian Department of Primary Industries and Regional Development. A reproducible framework will be developed to introduce controlled problems into otherwise valid data. These may include missing measurements, isolated spikes, clipping, duplicated records, time shifts, calibration offsets, sensor drift, increased noise and periods in which a sensor becomes stuck at a constant value.
Because each problem will be introduced in a controlled way, its type and severity will be known. The student will compare conventional statistical quality-control methods with machine-learning approaches that classify the problem and estimate its severity.
The central question is whether common data-quality problems can be recognised using methods that generalise across very different kinds of scientific observations. The project will compare domain-independent models with models tailored to each data source and investigate which failures are readily distinguishable, which are easily confused, and how much clean reference data are required.
A stretch goal will apply the best-performing methods to naturally occurring data-quality problems and compare the diagnoses with existing quality flags or expert assessments.
The project will produce a reusable scientific data-corruption framework, a documented diagnostic pipeline and a quantitative assessment of the opportunities and limitations of automated scientific data forensics.
| Student attributes | |
| Academic background | The project would suit a student studying one or more of:
The student should preferably have completed at least two years of undergraduate study. Previous experience with radio astronomy, oceanographic or weather data would be useful but is not required. |
| Computing skills | The student should be comfortable programming in Python and working with numerical arrays, time-series data or tabular data |
| Training requirement | Training will be provided |
| Project timeline | |
| Week 1 | Inductions and project introduction |
| Week 2 | Initial presentation
Review relevant literature and existing scientific quality-control methods. Select representative variables and data products from each domain. Define the defect taxonomy, experimental questions, evaluation measures and project scope. Present the proposed project plan. |
| Week 3 | Develop a common data-ingestion and representation framework for the three data sources. Identify suitable clean reference periods or observations. Implement initial data-quality transformations, including missing values, spikes, duplicated records and clipping. |
| Week 4 | Complete the controlled data-corruption framework. Add time shifts, calibration offsets, increased noise, sensor drift and stuck-sensor behaviour. Where relevant, add domain-specific problems such as radio-frequency interference-like contamination or missing frequency channels. |
| Week 5 | Develop conventional statistical baselines for detecting and diagnosing the introduced problems. Establish classification and severity-estimation metrics. Evaluate the baselines separately for each data source |
| Week 6 | Develop the first machine-learning diagnostic models. Compare domain-specific models with a common model trained across multiple data sources. Conduct a mid-project review and refine the remaining experimental scope |
| Week 7 | Investigate performance across different problem severities, observation lengths and noise levels. Test whether a method trained on one data source or observation period generalises to previously unseen data |
| Week 8 | Analyse which data-quality problems are readily distinguishable and which are commonly confused. Apply the best-performing methods to selected naturally occurring data-quality issues and compare them with existing quality flags or expert assessment where available. |
| Week 9 | Final presentation |
| Week 10 | Final report |