Project area/S
- Radio Science/ Solar physics
Project Details
At low radio frequencies the Sun appears very different from its appearance at optical wavelengths. Various structures can be seen at different frequencies, both transient and persistent. These surface features can have a direct impact on “Space Weather” at the Earth. Mapping these features, and the intervening “heliosphere” to create Space Weather forecasts is a huge international effort. However, images of the Sun at metric wavelengths do not contribute to this modelling at the present time.
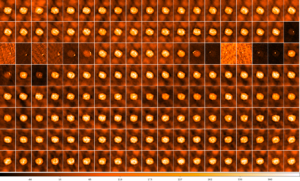
We have a set of daily observations of the Sun spanning several years. Observations have been taken at 80 and 162 MHz by the Murchison Widefield Array (MWA) over hundreds of days. All of these observations can be turned into a high-fidelity images.
The aim of this project is to process these data and make them available to the international community in an accessible format. This will involve making images, and then mapping these onto the spherical surface of the Sun. There are many possible directions that the project can take, depending on the interests of the student. Possibilities include creating a processing pipeline for automatic, rapid dissemination of the data, or drawing scientific conclusions from a subset of the data.
Student Attributes
Academic Background
This project would appeal to someone with an interest in solar physics, space weather, or providing forecasting information to those communities. Anyone with a physics background would be suitable. Many engineers/computer scientists/mathematicians would also be a good fit, especially if they have the maths background to map 2D Earth-bound observations into 3D space.
Computing Skills
Experience with python is desirable, some experience with programming will be required
Training Requirement
We will provide some training on the use of supercomputers and standard astronomical tools for visualising large datasets.
Project Timeline
- Week 1 Inductions and project introduction
- Week 2 Initial Presentation
- Week 3 Background reading and learning to process a sample data
- Week 4 Definition of the sample that will be studied, decision on project path
- Week 5 Development of rapid pipeline
- Week 6 Processing of ultra-low frequency observations
- Week 7 Explore virtual observatory server
- Week 8 Preliminary Science Analysis
- Week 9 Final Presentation
- Week 10 Final Report

A series of images of the Sun over time as imaged by the Murchison Widefield Array.