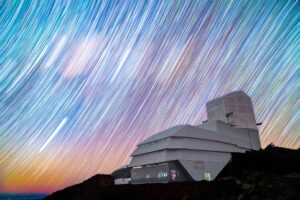
Caption: The Vera C. Rubin Observatory, our window to the dynamic universe. Credit: Ru-binObs/NOIRLab/SLAC/NSF/DOE/AURA/H. Stockebrand
The First Look of the Vera C. Rubin Observatory has ushered in the next “big data” era in astronomy. This project will use time series analysis to delve into data from the Zwicky Transient Facility to identify stellar variability and apply those techniques to new alert stream brokers from the Rubin Observatory.
The Universe is a dynamic place, and stars can vary on rapid timescales (days to months). Characteristics of this variability can provide clues to the nature of the system (pulsating stars, or stars interacting with a black hole or neutron star), which enhances our overall understanding of how stars grow and evolve.
The techniques used to mine these data are also rapidly evolving and have a wide range of real world applications in data science.
| Academic background | Physics/astronomy/computing |
| Computing skills | Some python |
| Training requirement | n/a |
| Project timeline | |
| Week 1 | Inductions and project introduction |
| Week 2 | Initial presentation |
| Week 3 | Learning analysis techniques |
| Week 4 | Learning data & Rubin Brokers |
| Week 5 | Applying to ZTF data |
| Week 6 | Applying to ZTF data |
| Week 7 | Applying to Rubin brokers + interpretation |
| Week 8 | Interpretation of data |
| Week 9 | Final presentation |
| Week 10 | Final report |